
Mind the Wealth Gap!
3 ways to look at wealth inequality

If you’ve ever been on the London Underground, you’ve see the signs and heard the warning: Mind the Gap!
We hear warnings about wealth inequality a lot, and we generally have some idea what it is (and what it looks like). We know that, simply put, wealth inequality is the measure of difference in people’s net worth. We know that wealth inequality is related to but different than income inequality, which measures the gap between high and low earners. (For example, in 2024, CEOs were paid 281 times as much as a typical worker—in contrast to 1965, when they were paid 21 times as much as a typical worker.)
We might think of the difference this way: recently Elon Musk was awarded a trillion dollar compensation package by Tesla. This astronomical salary compared to other typical salaries signals income inequality; and the trillion dollars when invested and held in a variety of assets is an indicator wealth inequality.
When we’re looking at the wealth gap, we’re measuring the difference between what trillionaires like Elon Musk own and what everyone else owns. Or, widening the scope, we’re looking at the difference between the assets of the top .01%, 1% or 10% of wealth holders and the rest of the population. There are also, however, more specific wealth gaps we can and do track that measure wealth inequality as it intersects with race and gender. Looking at wealth inequality from all these perspectives is useful as we think about who bears what economic burdens and how to lighten them.
The Classic Divide: Rich vs. Poor.
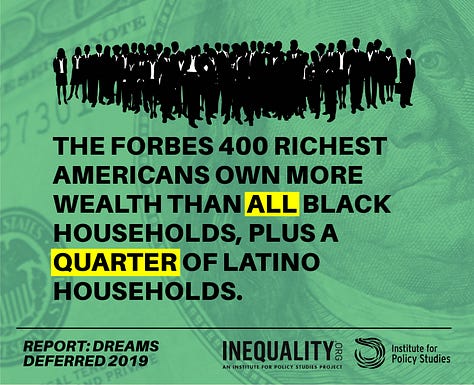
In the past twenty years, the fortunes of the elite have skyrocketed and wealth inequality has reached staggering levels, akin to those seen in the 1890s and 1920s - the first Gilded Age and the Jazz Age. As of 2022, the top 10% of households in the United States (measured by net worth) held about 70% of the country’s wealth. As of 2024, the top 1% owned close to one-third of all U.S. wealth. In the past year, this top 1% have seen their wealth increase by $4 trillion and the top 0.1% saw their wealth grow by 10%. The biggest factor in this growth has been stock market returns. These numbers tell us that we have a problem. They are enormous red flags that returns are not being enjoyed equally and that the economy is not working the way it should. Negative outcomes may include low social mobility and political instability.


Measuring the Racial Wealth Gap.
If we add race into the equation, we start seeing another facet of inequality. Studies shows that, between 2019 and 2022, while the ultra-rich were enjoying spectacular returns, other families were lagging behind, Black families in particular. In 2022, median wealth was approximately $44,890 for Black households, $62,000 for non-white Latino or Hispanic households, and $285,000 for white households. Put differently, for every $100 in wealth held by white households, Black households held only $15. This gap exists even within the upper echelons: in the top 10% of wealth holders, only 3.6% of this population identifies as Black and, while the median net worth for white families in this income group is $1,789,300, for Black families it is $343,160.

This racial wealth gap has persisted through various historical moments and political regimes, immune to easy remedy. There is debate over the most important contributing factors, but they include paying discriminatory interest rates and getting lower value for assets as well as exclusion from wealth-building opportunities. In addition, lack of inheritance impedes the creation of intergenerational wealth. Inheritance matters and, to this point, studies have shown that white households inherit over 5.3 times as much as Black households and 6.4 times as much as Hispanic households.
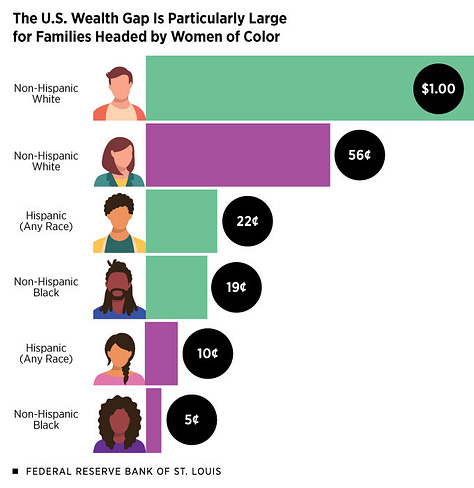
Looking at the Gender Wealth Gap.
The gender wealth gap is also a measurable reality. In 2019, a single woman (never married) owned $0.34 to a single man’s $1. In 2022, this gap narrowed to a woman owning $0.68 to a man’s $1, but women’s gains in wealth-holding are far from guaranteed. The gender wealth gap, like the racial wealth gap, stems from historical exclusion from wealth-building opportunities and has been exacerbated by the gender wage gap (for interesting language analysis of the wage gap, check out Heavy Meta’s post). Many of the historical obstacles, like the prohibition on married women owning property, have been removed. But one of the largest remains: carework.


Engaging in carework - raising children as well as taking care of parents - has negative effects on wealth-building, since the carer either forgoes paid employment or works less than full-time and does not pursue advancement opportunities. This results not only in less income but also smaller work-based retirement funds (as Jana Hlistova writes) and fewer lucrative opportunities. In a different-sex relationship, the carer is typically the woman (there may be less gendering of care in a same-sex relationship, as Lindsey Stanberry revealed, but not always). Once again, inheritance is also a factor. Men and women may both inherit money and assets, but “when examining the composition of assets that men and women receive, [there are] strikingly gendered patterns.” Men tend to inherit business assets, land, and houses (assets that generate wealth and get tax-preferred treatment), while women inherit cash, such that “intergenerational transfers appear as an essential driver of gender wealth disparities.” Finally, lest anyone think that all women are in the same boat, they are not. Black and Indigenous women hold the least wealth of any groups because they encounter obstacles that exist at the intersection of race and gender.


Ultimately, then, when we think about ways to remediate wealth inequality, we need to take into account the various forms of discrimination that factor into the creation of unequal economic opportunities. That is to say, we have to mind all the gaps!
An observation (US-based, especially in 1st generation immigrant communities): women often land the primary child-rearer role because “it makes more sense” for a father to keep his job because - guess what? - he earn significantly more.
Wow, these are great and sobering graphics! So many ways to present forms of the wealth gap.